(Last updated: 09/13/2019)
Human colon adenocarcinoma HT-29 cells were treated with anticancer compounds at various concentrations for 6 or 16 h. Gene expression changes were analyzed with GeneChip Human Genome U133 Plus 2.0 Array (Affymetrix).
Hierarchical cluster analysis based on the collection of gene signatures of 83 anticancer compounds (129 treatment samples). In total 4869 probe sets were used for clustering. The values in the heatmap are the logarithm of sample-to-control ratio of intensity values. Neither normalizing nor scaling was performed. Up- and down-regulated genes are colored in red and green, respectively.
![]()
Hierarchical clustering analysis of the gene signatures of HT29 cells treated with 38 kinome-targeted drugs. In total 2458 probe sets were used.
![]()
Up- or down-regulated genes in the clusters.
| Mode of action | up-regulated | down-regulated |
|---|---|---|
| Classical DNA damaging agents (16 compounds) |
DNAdamage_up.csv | DNAdamage_down.csv |
| HDAC inhibitors (5) | HDACi_up.csv | HDACi_down.csv |
| Tubulin binding agents (6) | Tubulin_up.csv | Tubulin_down.csv |
| proteasome inhibitors (5) | proteasomei_up.csv | proteasomei_down.csv |
| ER stress inducers (4) | ERstress_up.csv | ERstress_down.csv |
| Raf/MEK/ERK inhibitors (6) | RAF_up.csv | RAF_down.csv |
| PI3K/AKT/mTOR inhibitors (7) | PI3K_down.csv |
Based on our gene expression data of anticancer agents and the C-map algorithm (Lamb et al. 2006), we provide this calculation program (connectivity scoring analysis) to compare gene signatures of test compounds to those of antitumor agents in our database for prediction of their likely modes of action.
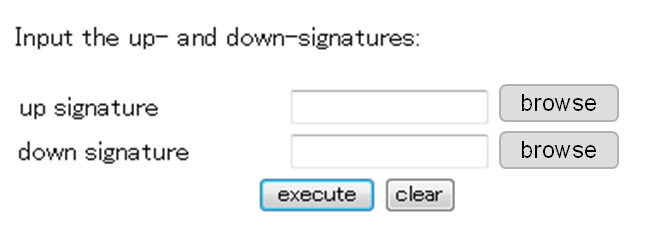
Example of input files: GR033-up3-300.txt (up) GR033-down3-300.txt (down)